
Binomial Logistics Regression
เป็นการบอกว่า หากตัวแปรต้นนั้นมีค่าเท่าไหร่ จะถูกจับกลุ่มไว้ในกลุ่มนั้นๆ โดยเรียกชื่อ Graph นี้ว่า Logit และมีเส้นแบ่งเขตแดนกลุ่มเป็น Decision Boundary เช่นหากว่ากินเยอะในระดับนึง จะถือว่ากินจุ หรือ ไม่กินจุ
โดยค่าจะไม่ออกมาเป็นความเป็นไปได้ (Probability) แต่จะเป็นความน่าจะเป็น ว่าค่านั้นๆอยู่ในกลุ่มใดๆ (Likehood)
Assumptions + Requirements
- Dependent 1 ตัว → Dichotomous ( Nominal ที่มี 2 กลุ่ม )
- Independent >= 1 ตัว → Nominal / Continuous
- Independent of observation
- มากกว่า 15 case ในแต่ละ Independent Variable
- Linear Relationship
- No multicollinearity (วัดด้วย Correlations ระหว่างตัวแปร)
- No significant outlier/influential
Tests
- Analyze → Regression → Binary Logistic → ใส่ตัวแปร
ใส่ตัวแปรต้นไปในแต่ละ Block ว่าให้แต่ละ Model เรื่มจากตัวแปรไหนก่อน (ถ้าโจทย์บอกให้ทำ)
- บอก Categorical predictor values
Categorical → เอาตัวแปรที่เป็นแบบ Category → เลือก Reference category เป็น first/last (แล้วแต่ตัวแปร)
- Options
Options →
- Statistics and Plots
- เลือก Classification plots, Hosmer-Lemeshow, goodness-of-fit, Casewise listing of residuals and CI for exp(B)
- Display
- เลือก At last step option.
สร้าง Case Summary
- Analysis → Reports → Case Summaries
Reporting the result

ดูตรงโมเดลที่ของตารางนี้ที่อยู่ในแต่ละ Block ถ้าอันไหน Sig น้อยที่สุดก็เลือกอันนั้น
Example :

Model 1 ตัวแปร Intervention อย่างเดียว

Model 2 ตัวแปร Intervention + Duration
Model 1 ใช้ Intervention เป็นตัว predictor มีค่า Chi-Square ที่ 9.926 และมีนัยสำคัญด้วย (เพราะ 0.02 < 0.05) ควรยังเก็บตัวแปรนี้ไว้อยู่
Model 2 ใช้ Intervention และ Duration เป็นตัว predictor มีค่า Chi-Square ที่ 9.928 ณ p = 0.007 แต่ในแถว ตัวแปร duration อย่างเดียว (block) นั้น ตัวแปรนั้นไม่ significant (0.964 > 0.05) จึงหมายความว่า ถ้าเพื่มตัวแปรนี้มา ก็ไม่ได้ทำให้แปลผลได้ดีขึ้น จึงควรตัดตัวแปรนี้ออกไป

Model 3 ใช้ Intervention, Duration และ Intervention x Duration เป็นตัว predictor มีค่า Chi-Square ที่ 9.989 ณ p = 0.019 แต่ดูที่แถว Block แล้ว ตัวแปรใหม่ที่เข้ามา ไม่ significant และยื่งทำให้ความ significant ของ model โดยรวมแย่ลงไปอีก จึงควรตัดตัวแปรนี้ออกไป
ดังนั้นถ้าจะใช้ ก็สามารถใช้ Model 1 (หรือใช้เพียงตัวแปร Intervention) เพราะใช้ Model อื่นแล้วก็ไม่ได้ช่วยอะไร เพราะตัวแปรที่เพื่มมาไม่มีนัยสำคัญ (การทำให้ Parsimony)
ถ้าได้โมเดลที่ต้องการแล้วให้ทำการรันอีกครั้งโดยเพิ่มการตั้งค่าบางอย่างดังนี้
- Save
- Predicted Values (ทุกอัน)
- Influence (ทุกอัน)
- Residual (Standardized)
- Option
- Statistics and Plots (Classification plot, Hosmer-Lemeshow GoF, Iteration history, Casewise listing of residual, CI for exp(B))
Likehood Ratio Test [-2 LL] (Deviance)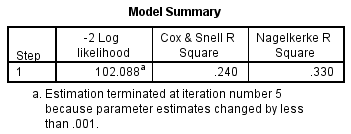
ไม่ได้บอกอะไร แต่ ถ้ามีมาก = เดาได้แม่นขึ้น (คล้ายๆ กับ R^2)
Cox & Snell R^2 / Nagelkerke R^2 เป็นค่า Pseudo R^2 และทำหน้าที่เหมือน R^2 ปกติเลย โดยของ Nagelkerke ค่านั้นจะแม่นกว่า
แสดงความว่า model นั้นเดาค่าได้ถูกต้องมากแค่ไหน (คะแนนเต็ม 1)
Wald Statistics Test
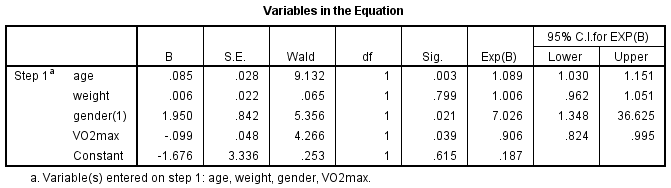
เหมือนพวก T-test / P-test จริงๆให้ดูความ Significant ของตัวแปร ในช่อง Sig.
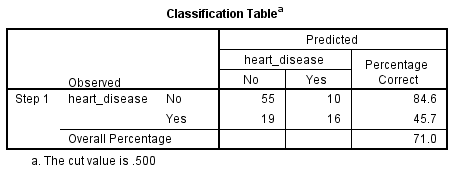
ตารางนี้แสดงผลลัพท์ว่าเดาถูกเท่าไหร่ เดาผิดเท่าไหร่ แล้วความถูกต้องนั้นคือกี่เปอร์เซ็นต์
Odds Ratio วัดดูได้จากค่า Exp(B) [ Exponent B ] โดยหน่วยเป็นความเป็นไปได้แตกต่าง xx เท่าตัว เมื่อเทียบกับอีกตัวแปรนึง
- หากมากกว่า 1 → ถ้า predictor เพื่ม = ความเป็นไปได้ (Odds) ที่ตัวแปรตามเพื่มตามสูงขื้น (ทิศทางเดียวกัน)
- หากน้อยกว่า 1 → ถ้า predictor เพื่ม = ความเป็นไปได้ (Odds) ที่ตัวแปรตามลดตามสูงขึ้น (ทิศทางสวนกัน)
สรุปผล
- A logistic regression was performed to ascertain the effects of age, weight, gender and VO2max on the likelihood that participants have heart disease.
- The logistic regression model was statistically significant, χ2(4) = 27.402, p < .0005.
- The model explained 33.0% (Nagelkerke R**2) of the variance in heart disease and correctly classified 71.0% of cases.
- Males were 7.02 times more likely to exhibit heart disease than females.
- Increasing age was associated with an increased likelihood of exhibiting heart disease, but increasing VO2max was associated with a reduction in the likelihood of exhibiting heart disease.
Reference
https://statistics.laerd.com/spss-tutorials/binomial-logistic-regression-using-spss-statistics.php